How Blue States and Red States Compare on Income, Poverty, Obesity, and Crime
I’ve always had a strong interest in government and society in general. How policy decisions affect the well-being of individuals, and in turn how those individuals feed that back into their preferences for government.
After the 2020 election, I was very curious to see how conservatives and liberals have drifted — to learn more about these two sides of America and the worlds each inhabit (in reality, it isn’t two sides, it’s a spectrum).
I started pulling data, and working with d3.js, a javascript graphing library. I delved into how best to simplify what is fairly complex data. It’s been fun, and very interesting. I’m looking forward to digging in deeper, and continuing to find new ways to find clean and enlightening representations about our society.
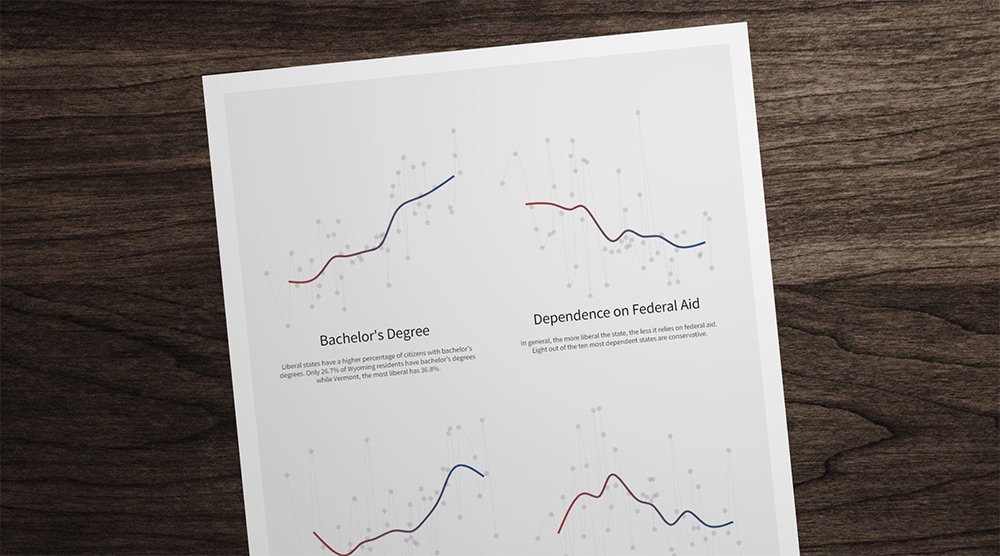
Overall, on the metrics of educational attainment, income, GDP, poverty, and obesity, along with suicide and murder rates all improve as a state becomes more liberal.
You can see the graphs here:
How Red and Blue States Differ on Key Metrics